EFFECT OF COTTON FIBER LENGTH DITSTRIBUTION ON YARN QUALITY
Eric Hequet and Dean Ethridge
International Textile Center, Texas Tech University
Lubbock, TX
The prediction of yarn quality based on the technological characteristics of the raw material has been improved by the use of the AFIS. Unfortunately, information about distributions of fiber properties that are measured by the AFIS is generally not used. The studies carried out at the ITC show that the AFIS length distribution is variety related. In addition, the percentages of both the shortest and the longest fibers have an important impact on yarn quality.
Introduction
During recent years, the Uster AFIS (Advanced Fiber Information System) has been increasingly used in the research projects carried out at the International Textile Center (ITC), Texas Tech University. The prediction of yarn quality based on the technological characteristics of the raw material has been improved by the use of the AFIS. The ITC has shown in the past few months the value of AFIS measurements such as the short fiber content or the standard fineness (Ethridge et. al., 1998; Hequet, 1999). Unfortunately, information about distributions of fiber properties that are measured by the AFIS are generally not used, because the data are not available in an electronic file. This makes the use of these data extremely unfriendly. Nevertheless, we decided to investigate the value of the distribution information with a focus on the influence of the fiber length distribution on the yarn quality.
Procedures
First Experiment
Fourteen USDA (United States Department of Agriculture) standards cottons were used in this first experiment. The following measurements were performed on fiber: . AFIS with 5 replications of 3,000 fibers, . Sutter Web Fiber Array with 3 replications per technician and two technicians, . Peyer AL 101 with 6 replications
Second Experiment
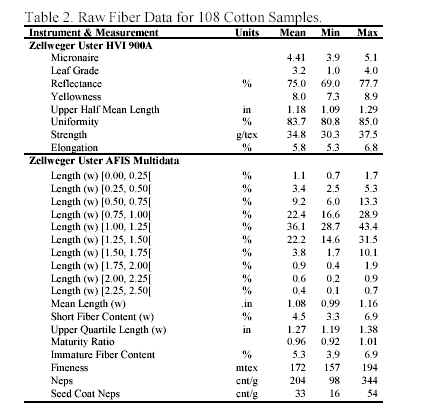
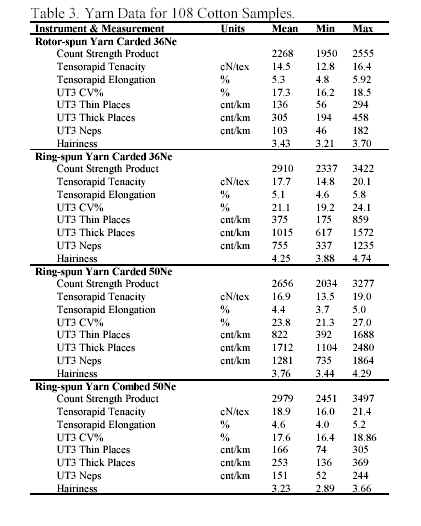
Variety evaluation tests were performed at the ITC during the 1998-99 crop year. Eighteen U.S. Upland cotton varieties were represented. Each variety was grown in three locations and two replicated samples were taken at each location. Therefore, a total of 108 cotton samples were collected (18 x 3 x 2). The cotton fibers from each variety were processed through the Short Staple Spinning Laboratory at the ITC and were made into both ring-spun (36 and 50 Ne carded, 50 Ne combed) and rotor-spun yarns (36 Ne carded). The following measurements were performed on fiber and yarn:
Fiber Tests:
. Zellweger Uster HVI 900A: 4 mike measurements, 4 color-grade measurements, 10 length and strength measurements.
. Zellweger Uster AFIS Multidata: 5 replications of 3,000 fibers
Yarn Tests:
. Zellweger Uster Tensorapid: 10 breaks per bobbin and 10 bobbins
. Zellweger Uster UT3: 400 yards per bobbin and 10 bobbins
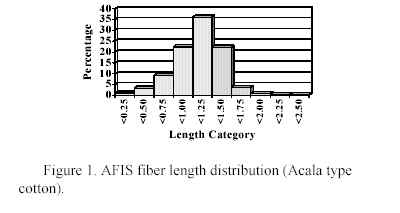
The printout from the AFIS provides us with a distribution of the length by weight. The histogram is built based upon the percentage of fibers in each of the 40 length categories, from 0 to 2.5 inches with an increment of 1/16th of an inch. In order to get a first look at the data provided on those 108 cotton samples, we limited the number of length categories to 10 by aggregating 4 categories together; therefore, the length category increment became 0.25 inch. A brief statistical summary of fiber properties is given in Tables 2 and 3, showing the mean, minimum and maximum values for each characteristic. An examination of this data reveals that all of the cottons exhibit relatively good fiber properties, with a low short fiber content, good length and maturity and high strength levels. The percentages in the last two AFIS length categories are very low, for this reason they have been aggregated for all the following analysis.
Third Experiment
Two commercial cotton bales were selected. A very low amount of ELS cotton was added (2% and 5%) in order to check if the addition of a very small amount of long fibers would increase significantly the CSP. The same measurements used in the second experiment were taken on the fibers and yarns.
Results and Discussion
The first experiment grew out of an anomaly with AFIS measurements. Figure 1 shows a typical AFIS length distribution by weight for Acala- type cotton.
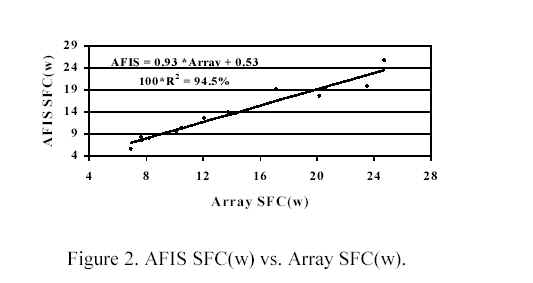
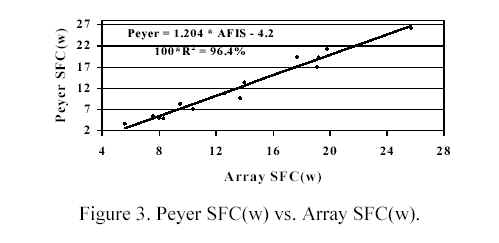
During the past few years, thousands of cotton samples have been analyzed at the ITC using the AFIS. Results for most of the cottons indicate a very small percentage of fibers in the length categories of 2 inches and longer. We can postulate either that those very long fibers really exist or that the AFIS over- estimates the length of the longest fibers. To investigate this, 14 USDA standard cottons were tested on the AFIS, Sutter Web Fiber Array and Peyer AL 101. Results showed that the instruments correlate very well for the shortest fiber percentages (Figures 2 and 3), although the levels are different.
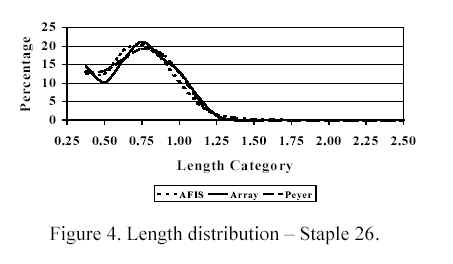
For the very short-staple cotton (staple 26), the length distributions obtained are very similar (Figure 4).
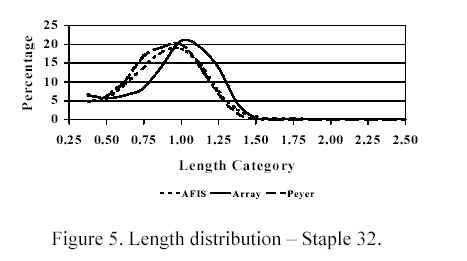
For the short-staple cotton (staple 32), AFIS and Peyer are in good agreement, but the Array method tends to get higher percentages for the longest fibers (Figure 5).
For the medium (staple
35) and long (staple 40) fibers, the discrepancy between instruments is clear (Figures 6
and 7).
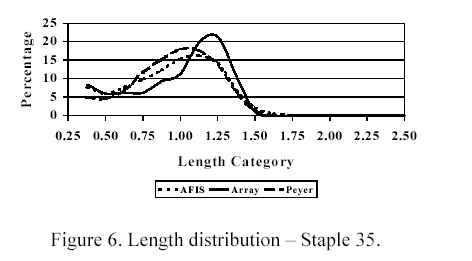
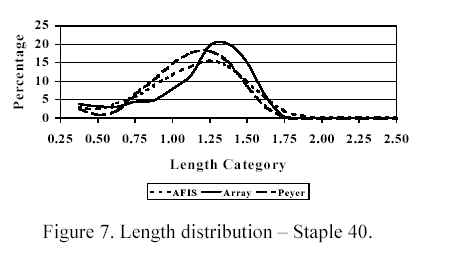
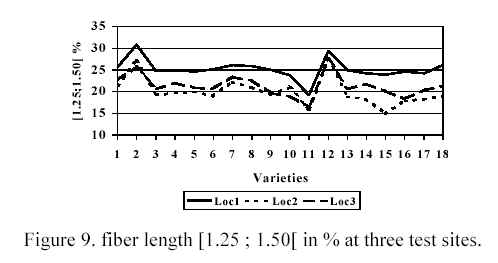
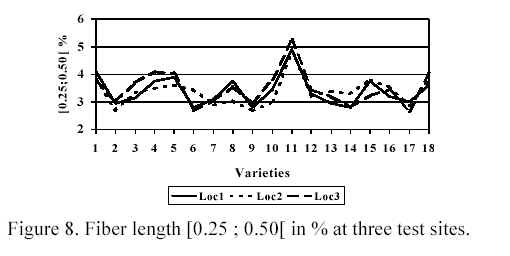
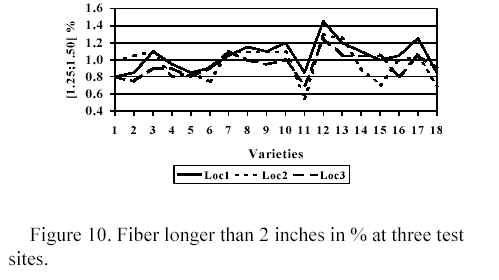
Neither the Peyer nor the Array showed any fibers to the longer than 2 inches, but the AFIS did indicate some of these for most of the samples. This suggests that the AFIS tends to over- estimate the length of the longest fibers. One hypothesis to explain this result is that the speed of the fibers passing trough the sensing device is not constant; i.e., the longer the fiber, the higher the friction forces for the air-to-fiber interface. This could lower the speed, resulting in a longer electronic signal. Given this anomalous result with the AFIS, the question arises whether it is a useless artifact or if it has predictive power. This led to the second experiment involving 18 upland varieties grown in 3 locations with 2 field replications per location. Using the AFIS multidata, for each length category, defined, an analysis of variance was done. Figures 8, 9 and 10 give the variety and location effects for the three length categories. For the length category [0.25; 0.50], the variety effect is highly significant, but the location effect and the interaction effect � are not statistically significant. For the length category [1.25; 1.50] both the variety and the location effects are highly significant, but the interaction effect location*variety is not. For the fibers longer than 2 inches, the variety effect is highly significant, the location effect significant and the interaction effect location*variety non- significant. These results suggest at least two very important things. First the length distribution by weight is variety related; this implies that breeders could modify the length distribution. Second, the longest fibers measured with the AFIS, although a very small percentage of total fibers, are also variety related. This means that the fibers measured as too long by the AFIS cannot be dismissed as meaningless.
To investigate further, we calculated the coefficients of correlation between major yarn characteristics and the percentages of fibers in the different length categories. For Count Strength Product (CSP), these correlations are quite similar for all the types of yarns.ring or rotor, carded or combed (Figure 11).
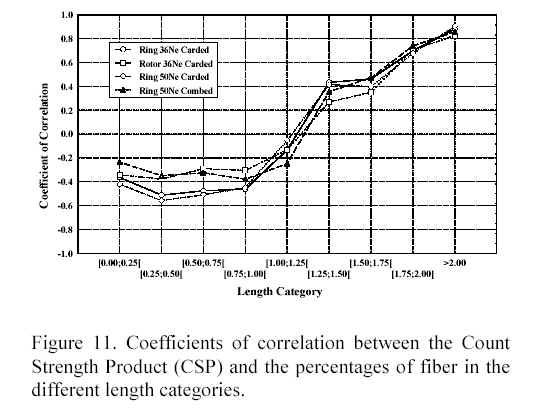
For the fibers shorter than one inch the correlation coefficients are negative in all cases; therefore, the larger the share of these length categories, the lower the CSP. For fibers in the 1.00-to-1.25 category the correlation coefficients are still negative but are near zero. As the length categories increase above this level, the correlations become positive and large. The category longer than 2 inches exhibits the highest positive correlation of all. The calculation of the correlation coefficients between the CSP and the various fiber properties used for prediction is given in Table 4.
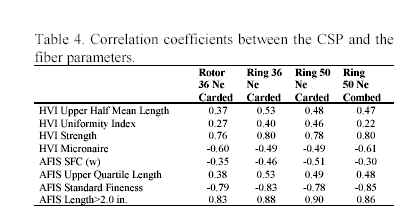
It shows that the AFIS percent of fibers longer than 2 inches is the best length parameter to predict CSP. In fact, it performs better than the HVI strength and the AFIS standard fineness. This is even more startling given that the percentage of fibers longer than 2 inches averages only 1 percent on the 108 samples tested .
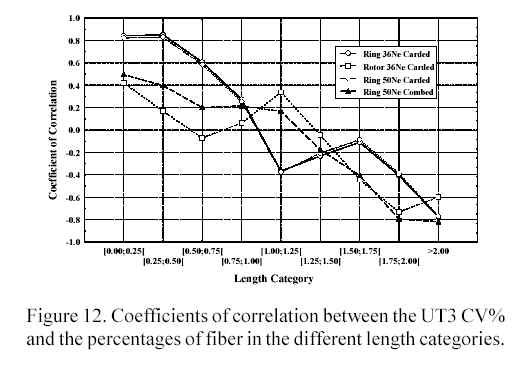
Figure 12 shows the coefficients of correlation between the UT3 non-uniformity (CV%) and the percentages of fiber in the different length categories. Note the following: . The carded ring spun yarns exhibit very similar behavior. The length categories giving the best correlation coefficients with the yarn uniformity are: [0.00;0.25], [0.25;0.50] and [>2.00], with a positive correlation for the shorter fibers and a negative correlation for the longer fibers. Therefore, the higher the short fiber content, the higher is the yarn CV%; and the higher the long fiber content, the lower is the yarn CV%. . The UT3 CV% of the combed ring-spun yarn exhibits a very good correlation with the percentage of fibers longer than 2 inches and a quite poor correlation with the shorter fibers. This is logical because a large part of the shorter fibers has been removed during the combing operation. . For the rotor spun yarn, the negative effect on the yarn uniformity of the shorter fibers is limited. But the fibers between 1.75 and 2 inches exhibit the highest correlation with the yarn CV%. The fibers longer than two inches give a lower correlation, probably because a part of them (the extremely long fibers) wrap around the yarn and create imperfections. This is likely related to the rotor diameter and it will be necessary to test different rotor diameters to confirm this hypothesis.
Figures 13 and 14 show the coefficient of correlation between the UT3 thin and thick places, respectively, and the percentages of fiber in the different length categories. The figures look very similar to the UT3 CV% and similar conclusions can be made.
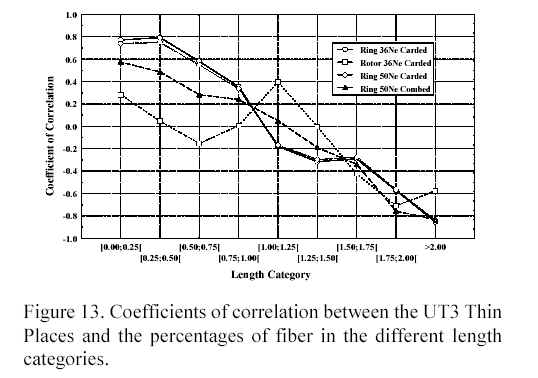
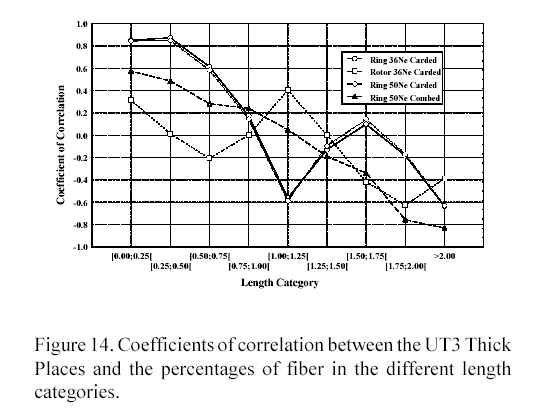
Figure 15 shows the correlation coefficients between the UT3 neps and the percentages of fiber in the different length categories. The correlation levels are generally lower than were exhibited for the previous parameters. However, for the carded ring-spun yarns of 36 Ne and 50 Ne, correlations of neps with the length category [1.00;1.25] are fairly high. We currently have no coherent hypothesis to explain this.
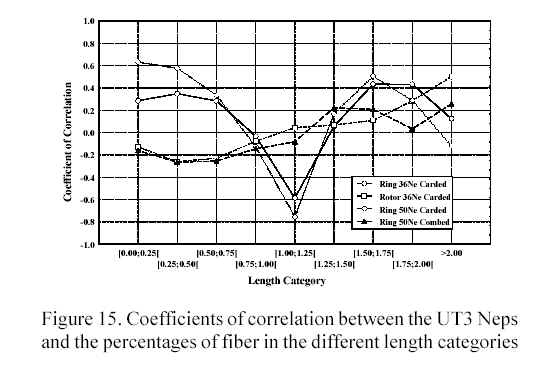
Figure 16 shows the correlation coefficients between the UT3 hairiness and the percentages of fiber in the different length categories. The shapes of the curves are quite similar for all the types of yarns.ring vs. rotor and carded vs. combed. For the fibers shorter than 1/4 inch, the correlation coefficients have positive signs and are very high in all cases. Therefore, these very short fibers are important contributors toward increased yarn hairiness. Conversely, correlation coefficients for the fibers longer than two inches are also high but with negative signs; therefore, these fibers, which measure very long, are important contributors toward decreased yarn hairiness.
Figure 17 shows the correlation coefficients between levels of the combing noils and the percentages of fiber in the different length categories. As expected, the correlation coefficients very high for the three shortest length categories but low for the other length categories.
Table 5 shows the multiple regression coefficients between the fiber and yarn parameters and the percentages of fiber in the different length categories (Forward Stepwise regression with Sigma-restricted parameterization). These results reveal that the only statistically significant length parameter related to the CSP is the percent of the fibers longer than 2 inches. For the yarn regularity (CV%, thin places and thick places) the important parameters are the very short fibers (shorter than � inch) and the very long fibers (longer than 2 inches).
The third experiment was done to obtain some confirmation of effects of the longest fibers on the yarn strength. Using two commercial bales of Upland cotton, ring-spun 30 Ne yarns were made. Then very small amounts (2% and 5%) of ELS cotton fibers were mixed with the Upland cotton and also ring spun into 30 Ne yarns. Figure 18 gives results on CSP and Figure 19 gives results on tenacity. They both show a tendency for increased strength with small additions of ELS. On average for the two bales, adding 2% ELS increased the CSP 3.8% and the tenacity 7.7%. Adding 5% ELS results in average increases of 7.3% in CSP and 8.5% in tenacity. These limited results give encouragement to design a more complete study using larger samples and optimizing the spinning parameters for each mix tested.
Conclusions
The length distribution data available with the AFIS appears to contain information that is useful to both the cotton breeders and the spinners. Since the length distribution clearly appears to be variety related, it may provide a new tool for cotton breeders in their efforts to reduce short fiber content. The causes for the AFIS measuring some fibers as longer than 2 inches are not understood; nevertheless, this measurement exhibits the highest correlation with the yarn CSP. For the carded ring-spun yarns, the shortest fibers and the longest fibers exhibit the highest correlation with the yarn CV%, the number of thin places, and the number of thick places. For the combed ring-spun yarns and the rotor-spun yarns, the longest fibers exhibit the highest correlation with the yarn CV%, the thin places, and the thick places. The correlation coefficients between the different length categories and the number of neps are generally low. The shortest and the longest fibers are highly correlated with the hairiness for all the types of yarns. The shortest fibers increase hairiness and the longest fibers decrease hairiness. The three shortest length categories are highly correlated with increased combing noils.